2023|Effect of the preform fabrication process on the properties of all-silica optical fibers
By A.B. Grishchenko
Manufacturing and testing of all-silica fibers resistant to UV and Gamma radiation.
Andrey Grishchenko, Dmitrijs Saharovs, Mario Paredes
Ceram Optec SIA, Domes 1, Livani, LV5316, Latvia;
Armadillo SIA , Krisjana Valdemara iela
33 – 11A, Riga, LV1010, Latvia
ABSTRACT
This study examined the influence of the composition of the core material, preform production technology and posttreatment with hydrogen on the optical stability of the all-silica optical fibers to UV radiation. Elaborated fiber coating, consisting of carbon and polyimide layers, allows hydrogen saturation at 250 °C but shows excellent hermeticity at room temperature.
The comparative study of the optical fibers not saturated with hydrogen showed that silicas with both high and low content of hydroxyl groups are observed to have sufficient initial UV transparency and resistance to UV irradiation. More significantly is the occurrence of defects in the structure of silica causing absorption in the region of 200 – 400 nm as well as the presence of Si-H and Si-Cl groups, which act as precursors for defects with absorption peaks at 214 nm and 330 nm. The deposition method of a reflective cladding had a significant effect on the incidence of defects and Si-H groups in the fiber core. The most significant effect on induced loss was caused by hydrogen treatment of the fibers.
The findings of this study provide strategies to optimize the production of optically transparent all-silica fibers for various spectral regions and significantly improve their stability under UV and gamma irradiation.
Keywords: All-silica preforms manufacturing, chlorine free silica, OH content, optical fibers, solarization, UV-induced loss, hermetic carbon coating, hydrogen treatment.
INTRODUCTION
Lasers emitting visible and UV light, diagnostics of thermonuclear fusion reactors, and astronautics all require optical fibers with sufficient transparency in given region of the spectrum, high radiation strength, and resistance to UV or gamma irradiation. The most suitable for such tasks are fibers with a synthetic silica core and a reflective cladding doped with fluorine – “all-silica light guides”. However, all-silica light guides available on the market often do not meet customer requirements. Improvement of fiber resistance to UV and gamma irradiation is an important task for the development of modern energetics and laser technique.
The current market provides a wide variety of synthetic silica materials with extremely low concentration of metallic ions
— “pure silicas” [1, 2, 3], but with different concentrations of defects, halogens and OH groups, which could be unevenly distributed inside core material. Studies of impurity distributions inside core material provide an understanding of manufactured all-silica fiber properties and silica type dependency. The most promising approach for the commercial-scale manufacture of preforms for all-silica fibers is to deposit a reflective fluorine-doped silica cladding on a “pure silica” rod by plasma vapor deposition techniques [4]. Ceram Optec SIA developed preform fabrication methods that employ an atmospheric pressure radio frequency (rf) plasma [Plasma Outside Vapor Deposition (POVD)] and low-pressure microwave plasma [Plasma Chemical Vapor Deposition (PCVD)] [5, 6]. This study observed all-silica fiber stability under UV light exposure, the role of core material type, preform manufacturing techniques and the effect of fiber hydrogen saturation. Our fibers were studied for the ITER project where the best stability under gamma radiation was observed in the hydrogensaturated fibers [7]. These observations have led to discussion of possibilities for development of radiation resistant and UV-stable fibers for different spectral regions.
FIBER MANUFACTURING TECHNOLOGIES
POVD and PCVD processes for preforms manufacturing
In the POVD process, gaseous precursors, such as SiCl4 and SF6, are introduced into atmospheric pressure with inductively coupled air plasma. In each deposition pass, a plasma torch is moved along the length of a silica rod [5]. Commercially available all-silica preforms are typically produced by the POVD process [8]. A schematic of the POVD apparatus is shown in Figure 1. The deposition process is run inside a screening box ( 1 ) fitted with windows for monitoring the process. A synthetic silica glass substrate rod ( 2 ) is placed on a glass-working lathe ( 3 ) equipped with a plasma torch ( 4 ) and is prepared for the deposition process. The same plasma torch ( 4 ) is used to fuse the rod to service handles ( 5 ), fire polish the rod and run the proper deposition process. During the deposition, precusors are introduced into the plasma torch zone through quartz nozzles located in the upper part of the torch. After the deposition process, the resultant preform is separated from the service handles using the same plasma torch.
In the PCVD process, the plasma is generated in an auxiliary tube at a pressure of ~5 mbar in a gas mixture heated to a temperature of ~1100 °C [6].
The PCVD process was initially proposed for silica deposition on the inner surface of a silica tube [4]. A distinctive feature of Ceram Optec apparatuses is that the substrate rod is located inside the tube. The silica tube with the deposit is used only as a reactor for silica deposition on the rod, rather than being the end-product. Figure 2 shows a schematic of the PCVD system. Before beginning the process, the assembly should be prepared using auxiliary equipment. To this end, it is necessary to fuse service handles ( 1 ) to the substrate rod ( 2 ), fire-polish the rod, then place it, together with the service handles, in the auxiliary silica tube reactor ( 3 ). The assembly is then mounted in a microwave resonator ( 4 ), the top end of the tube reactor is hermetically connected to a precursor delivery system and its bottom end is connected to a vacuum system. A part of the assembly, along the path of the microwave resonator, is placed in a furnace ( 5 ) and heated to a temperature of ~1100 °C. After the plasma ( 7 ) is initiated, the precursors are fed to the top part of the tube through a
vacuum-tight rotary joint ( 6 ). The vertical reciprocation of the resonator and the rotation of the substrate rod in the tube reactor ensure uniform growth of fluorine-doped silica glass layers. After the deposition process the service handles are separated using auxiliary equipment and are reused, if possible, whereas the tube reactor is recycled.
In both deposition processes, fluorine-doped silica layers are produced on the outer surface of a glass substrate rod. The maximum length of preforms produced at Ceram Optec by the POVD and PCVD processes is 1100 mm, and their maximum diameters are 50 mm and 30 mm, respectively. The complete POVD preform fabrication cycle, including reflective layer deposition and subsequent processing of the preform, can be performed using only the main apparatus and requires no additional equipment. The POVD apparatus can be readily modified to increase the substrate rod diameter. At the same time, the POVD rate decreases when increasing fluorine precursor concentration in the starting mixture. Accordingly, deposition efficiency decreases when increasing desired fluorine concentration in the deposit. For example, the deposition rate for layers with refractive index difference Δn = – 0.022 is six-fold lower than that of undoped silica.
The PCVD process requires not only the main apparatus but also a tube rinsing system, a glass-working lathe and reactor tubes as consumables. The preprocessing steps take a long time and require air cleanliness. On the other hand, the PCVD process enables the growth of heavily doped layers with effective Δn = – 0.029 which allows the numerical aperture of preforms to reach >0.29 in the case of an undoped silica core. The deposition rate is essentially independent of fluorine concentration and approaches that of undoped silica in the POVD process [9].

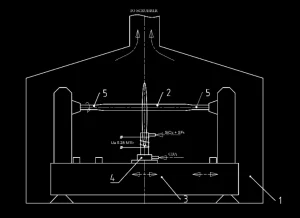
Figure 1. Schematic of the POVD apparatus: ( 1 ) screening box; ( 2 ) substrate rod; ( 3 ) glass-working lathe; ( 4 ) plasma torch; ( 5 ) service handles.
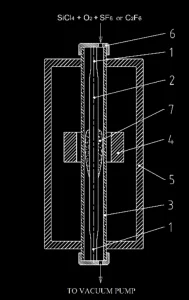
Figure 2. Schematic of the PCVD system: ( 1 ) service handles; ( 2 ) substrate rod; ( 3 ) silica tube reactor; ( 4 ) microwave resonator; ( 5 ) electric furnace; ( 6 ) vacuum-tight rotary joint; ( 7 ) plasma.
Fiber drawing and posttreatment
All-silica fibers were made by drawing preforms through a graphite furnace heated to a temperature close to 2000 °C. All samples were drawn at approximately the same furnace temperature. To prevent hydrogen escape from fiber structure, carbon-coated fibers with a secondary polyimide coating were manufactured. The process of hydrogen concentration changes in fibers was studied in carbon-coated fibers and compared with single polyimide-coated fibers of the same geometry. The drawing speed for fibers with carbon coating was 1.5-2 times faster than fiber of the same size without carbon. Hydrogen saturation of fibers was performed in a heated steel vessel with hydrogen pressure maintained at around 40 Bar and temperatures of 200 °C for fibers without carbon and 250 °C for carbon-coated fibers. The typical duration of the saturation process is 1 day for fibers without carbon coating and 7 days for fibers with carbon coating.
EXPERIMENTAL
The spectral characteristics of fibers in the 200 – 1700 nm range were measured by the cutback technique using a Spectro 320D optical scanning spectrometer (Instrument Systems, Germany). The UV source used in assessing the solarization resistance of our samples was a D2plus deuterium lamp (Heraeus Noblelight, UK). The UV radiation was focused by CaF2 lenses in a box under flowing nitrogen. A PSX-100 ArF excimer laser (Neweks, Estonia) was used as a stronger power source of radiation at a wavelength of 193 nm and was pulsed at a repetition rate of 10 Hz ( pulse duration > 5 ns). Measurements of hydrogen concentration in fibers were done by detection of attenuation increase at 1082 nm after fiber impregnation with H2. Absorption peak at 1082 nm is clearly visible in quartz with both high and low content of hydroxyl groups. Concentration of hydrogen molecules was calculated using the ratio of absorption peak values at 1240 nm and 1082 nm and is based on [10], where it is shown that the 3.4 dB/km loss increase at 1240 nm corresponds to 1018 H2 molecules/cm3 of silica. In cases when the amplitude of the H2 overtone band at 1240 nm or 1082 nm could not be measured, due to insufficient or excessive attenuation or other interferences, the concentration of H2 was obtained by measuring the ratio R between the intensities of the H2 Raman band at 4138 cm−1 and the fundamental vibration bands of silica glass. The scaling coefficient between the H2 concentration and R was obtained by measuring both the infrared attenuation band of H2 at 2416 nm [11] and the corresponding Raman band in the same H2-impregnated fiber and making use of the published [11, 12] absorption cross section for H2 in silica glass.
Circular slices of core materials and manufactured preforms with diameter 22-28 mm and thickness 3-5 mm were supplied to Corning R&D for further sample preparation and scanning of OH, Cl and F content. Fourier-transform infrared (FTIR) spectroscopic determination of OH content was done on a Bio-Rad UMA500 FT-IR microscope with 100 um aperture. 32 scans of 100 um steps from middle to edge, relative to dry silica, were averaged at 16 cm-1 resolution at each point. Calculations were done according to [13]. Electron micro probe analyzer (EPMA) scanning for determination of Cl and F content was done in Corning R&D Laboratory with equipment set up developed by Corning R&D.
RESULTS AND DISCUSSION
Distribution of OH, Cl and F in core rods and typical all-silica preforms.
Table 1. List of available pure silica core materials, data from manufacturers and measured values.
|
No. of silica type |
Type of core material |
Manufacturing technology |
Catalogue value [1, 2, 3] |
Measured value |
||||
|
ОН, ppm |
Cl, ppm |
F, ppm |
ОН, ppm |
Cl, ppm |
F, ppm |
|||
|
1 |
Low OH and high Cl |
Vapor Axial Deposition and drying with Cl2 |
<1 |
~1000 |
0 |
<0.05 |
from 800 to 1200 |
|
|
2 |
Low OH and high Cl |
Outer Vapor Deposition and drying with Cl2 |
<1 |
<2500 |
0 |
<0.05 |
from 1500 to 3000 |
|
|
3 |
Low OH, low Cl and high F |
Outer Vapor Deposition and drying with F containing agents |
<5 |
<200 |
3000-4000 |
~3 |
~400 |
~3000 |
|
4 |
Low OH, no Cl and no F |
Outer Vapor Deposition and drying with CO |
<1 |
0 |
0 |
0.2 |
<detection limit |
<detection limit |
|
5 |
Intermediate OH and low Cl |
Vapor Axial Deposition no drying |
<200
|
No information |
No information |
from 10 to 60 |
100 |
<detection limit |
|
6 |
high OH (made from SiCl4) |
Direct flame deposition |
700 |
200-300 |
No information |
Not measured |
Not measured |
Not measured |
|
7 |
High OH (made from OMCTS) |
Direct flame deposition |
1000 |
<0.15 |
No information |
Not measured |
Not measured |
Not measured |
Scanning for determination of Cl, F and OH content in core materials show good agreement with data from manufacturers’ catalogues. OH content: For Material 5, SiO2 soot, deposited by flame vapor deposition technique, was not introduced to any drying agent before sintering. We found variable concentration of OH groups in such silica — 10 ppm on edges of the circular cross section slice and concentration grows reaching 60 ppm in the core center. OH groups, after drying Materials 1 and 2 with chlorine, were not found by the FTIR method with detection limit 0.05ppm OH. Replacement of chlorine for fluorine-containing drying agents, see Material 3 in Table 1, leads to an increase of 2-4 ppm OH content which makes such material less applicable for the wavelength range > 2000 nm. Drying with the help of carbon monoxide removes OH groups to level <1 ppm; however, OH groups were detectable in Material 4 where typical OH concentration is 0.2 ppm. Chlorine is introduced to synthetic silicas during vapor depositions of soot if a silicon precursor compound contains chlorine or during soot drying stage if chlorine-containing agents were used. Use of chlorine-containing precursors lead to hundreds of ppm of Cl, but chlorine drying increases concentration to thousands of ppm. For Material 1, our measurements show gradual increase of Cl concentration from 800 ppm in the center to 1200 ppm in the areas equidistant to the center and outer surface of the rod. Concentration drops back to 800 ppm near the outer surface. Material 2, very well known in tubular shape, has Cl concentration of around 3000 ppm on the inner surface of the tube and gradually drops to 1500 ppm on the outer surface of the tube.
Determination of OH and halide concentration in sleeved and plasma deposited layers, as well as influence of flame treatments on OH distribution in manufactured materials, was done by FTIR and EPMA scanning of the preforms (Figure
3).
The preform, designed for radiation resistant single mode fiber, includes a 1 mm core that is halide-free and low OH, plasma-deposited fluorine-doped layers and layers deposited by sleeving with low OH silica tubes. In more detail, the halide-free core material with OH content ~0.2 ppm (number 4 in Table 1) was deposited with a fluorine-doped reflective layer with Cladding to Core Diameter Ratio (CCDR) = 8.4, providing NA=0.13 for the core. The procedure for reflective layer deposition was alternated with elongation procedures. When the deposited preform reached 30 mm diameter, the deposition process stopped and elongation to diameter 20 mm was performed. After elongation, the deposition process restarted. We performed 6 elongations before CCDR = 8.4 was reached. Final deposition of pure silica to CCDR = 21 was done by two sleevings with tubes from Material 2. The studied preform, according to Ceram Optec names system, is STS21(8.4) NA=0.13.

Figure 3. Slice of the preform 18J007 and scanning direction
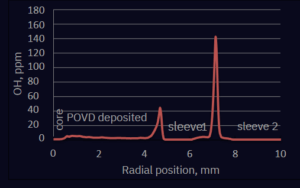
Figure 4. Distribution of OH groups for the preform 18J007 (STS21(8.4) NA=0.13).
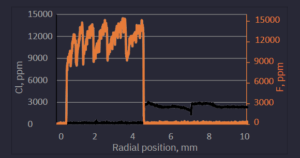
Figure 5. Distribution of Cl and F for the preform 18J007 (STS21(8.4) NA=0.13).
We can conclude that the OH content in the POVD-deposited layer is < 5 ppm and sleeving with H2/O2 flame gives local increase of OH concentration to hundreds of ppm of OH. Further preform heating produced a smaller and wider OH peak which could be explained by relatively fast migration of OH groups in hot silica. The chlorine content in POVD-deposited layer is ~100 ppm and the concentration of F is between 9000 ppm and 13000 ppm. Each drop of F concentration coincides with strong plasma heating during preform elongation. Furthermore, we observe F evaporation from the surface of the fluorine-doped layer during strong heating of each elongation.
Transmission of pristine fibers based on different core materials and influence of deposition technique.
Influence of preform manufacturing technique on spectral attenuation curve could be seen in Figure 6. All fiber samples have similar structure core diameter = 200 μm, cladding diameter = 220 μm, diameter of polyimide coating = 245 μm.

Figure 6. Spectral attenuation curves for pristine low OH optical fibers 200/220/245P based on core material 1 (Table 1), with reflective cladding deposited via different manufacturing techniques (PCVD and POVD).
The measured spectral characteristics of the low OH fibers drawn out from the POVD and PCVD preforms differ significantly (Figure 6). The POVD fibers have increased optical losses at wavelengths λmax = 330 nm and 640 nm. The absorption peak at λmax = 640 nm often originates from the drawing of thin fibers under nonoptimal conditions [14], but according to our observations the increased absorption at λmax = 640 nm is also related to the preform fabrication process. Increased spectral losses in the low OH fibers near λmax = 330 nm and 640 nm are also indicated in catalogues of manufacturers, that employ the POVD process, to fabricate all-silica preforms [8]. This lends support to the assumption that the deposition method influences the spectral loss in WF fibers. The fibers drawn out from the PCVD preforms have no increased loss at λmax = 330 nm, and the peak at λ = 640 nm is considerably weaker, if any, compared to POVD fiber.
We assume this phenomenon is due to oxygen diffusion into the core material in the course of deposition. Excess oxygen leads to the formation of nonbridging oxygen hole centers, which absorb at λmax = 266 nm and 640 nm, and react with SiCl groups in the silica to form molecular chlorine that has an absorption band centred at λmax = 330 nm [15]:
![]() Si – O – Si ≡ + Cl2 (1)
Si – O – Si ≡ + Cl2 (1)
When selecting fibers for a certain wavelength range, it is important to know the transmission of pristine fibers as well as transmission changes during exploitation, especially if fibers will be introduced to strong UV or ionizing radiation. Spectral attenuation curves for pristine fibers, based on silica core materials with different OH and halides content, are presented in Figure 7. Besides the obvious conclusions about preferable applicability of high OH fibers in UV-VIS spectral region, and low OH for IR wavelengths, we add that Materials 3 and 5 (see Table 1) could be applied from 300 to 1700 nm and 1200 nm, respectively. Fiber based on Material 4 has broadband characteristics and could be applied for all measured spectral range. It was decided to select fibers with Materials 4, 6 and 7 for further UV solarization studies.
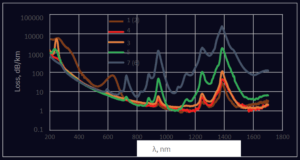
Figure 7. Spectral attenuation curves for pristine optical fibers 200/220/245P based on different core materials. Reflective layer deposited with POVD. Types of core materials according to Table 1.
Hermetically coated fibers and stability of hydrogen content
Stability of carbon layer deposition during the drawing process was evaluated by periodical measurements of electrical resistance of carbon-coated fiber. The drawing process was optimized to deposit a carbon layer, which allows saturation of fiber with H2 at temperature 250 °C, while providing virtually impenetrable hermeticity of H2 molecules at room temperature.

Figure 8. Loss of hydrogen in fiber. Spectral attenuation curves of hydrogen in fiber 200/220/245P fiber based on Material 1 from Table 1 (at room temperature).

Figure 9. Retention of hydrogen in hermetically coated fiber.
Spectral attenuation curves of hydrogen in carbon coated fiber 200/220/245CP, core Material 1 from Table 1 (at room temperature).
The hermetic carbon coating optimization of the drawing process was done for preforms with low OH core materials where H2 attenuation peaks in range 900-1700 nm have minimal interference with OH peaks of core material. It was experimentally shown that hydrogen saturation of carbon-coated fibers is reached after 7 days in a pressure vessel at 250 °C, while single polyimide-coated fibers reach saturation in 10-15 hours at 200 °C. Spectral attenuation curves of saturated fibers show significantly higher hydrogen peaks at 1082 nm and 1240 nm; and a significantly smaller OH peak at 1383 nm in single polyimide-coated fibers, compared to fibers with carbon coating. The concentration of hydrogen in fibers after treatment was estimated as 1×10¹⁹ H2 molecules/cm3 in the case of fibers without carbon coating and approximately two times lower for hermetically coated fibers. Hydrogen concentration in single polyimide-coated fibers equilibrated at room temperature after the saturation vessel was cooled down. Bearing in mind that solubility of gases drops with increase of temperature, and the fact that carbon layers are virtually impenetrable for H2 at temperatures lower than 150 °C [16], we can conclude that the decreased hydrogen concentration of carbon-coated fibers after saturation reflects the higher temperature conditions required for hydrogen equilibration. Additionally, the higher OH peak for carbon-coated fibers could be explained by increased fiber draw speed which produces more defects and stressed Si-O bond concentration. The findings from analysis of Figures 8 and 9 show that the concentration of H2 in fibers without carbon coating minimizes 10 times in 35 days (See Figure 9), and after 60 days the H2 peaks disappear completely. Furthermore, the analysis provides the practical conclusion that H2 concentration in carbon-coated fiber does not change after more than five years at room temperature (See Figure 8).
Studies of fiber stability under UV irradiation, influence of core material and deposition technique
Silica with high hydroxyl content (near 1000 ppm) is used in the fabrication of fibers for the UV spectral region. Rods for OH-rich preforms are typically produced by direct, one-step silica deposition. Raw materials are introduced into the flame of an oxygen-hydrogen burner with power sufficient for both silica deposition in the form of fumed silica and sintering of the deposit [1]. The use of a hydrogen-enriched flame for sintering may, in turn, lead to the presence of excess hydrogen in the sintered structure. No significant distinctions between the spectral characteristics of the UV fibers produced by the POVD and PCVD methods were detected, but the deposition method was found to influence the solarization resistance of the UV fibers (Figure 10).

Figure 10. Transmittance at λ = 214 nm as a function of irradiation time for 2-m lengths of the 200/220/245P fibers produced by the POVD and PCVD processes, core material 7 according to Table 1. Light source: D2plus deuterium lamp.
The solarization resistance of fibers is traditionally assessed from changes in optical loss at 214 nm where the increase in optical loss is contributed largely by the E‘ center with an absorption band peaking at λ = 214 nm. A similar effect of the fabrication method on radiation resistance was reported by Tomashuk and Zabezhailov [17]. We assume that the reduction in solarization resistance is due to the interaction of residual hydrogen with amorphous silica at elevated temperatures [12]:
( ≡ Si – O –Si ≡) + H2 → ( ≡ Si – OH) + ( ≡ Si – H) (2)
Favorable conditions for reaction (2) are created during both the growth of a reflective cladding on a substrate rod and the fiber drawing process.
The UV-induced increase in optical loss can, in turn, be accounted for by an increase in the concentration of E‘ centers which are formed from![]() ≡ Si – H groups according to the reaction scheme:
≡ Si – H groups according to the reaction scheme:
𝑈𝑉
(≡ Si – H ) → (≡ Si * ) + H (3)
The high temperature of the substrate rod during the POVD process leads to an increase in the concentration of ≡ Si – H groups and ultimately an increase in the optical loss at a wavelength of 214 nm if the fiber is used in the UV spectral region, due to E‘ centers.
The main difference between high OH Materials 6 and 7 is the ratio between H2 and O2 in the hydrogen flame for direct deposition process. Material 7 is used for cost-sensitive applications [1] and contains less hydrogen compared to Material 6. The much lower induced loss for Material 7 at 214 nm (Figure 11, 6 and 7) could be explained by faster formation of
≡ Si – H groups at higher concentrations of H2 in Material 6, compared to lower H2 concentrations in silica Material 7 (See Equation 2). On the other hand, Non-Bridging Oxygen Hole Centers (NBOHC) with attenuation peaks at 266 nm are clearly seen in Material 7, but not visible in Material 6. NBOHC is a more reactive defect compared to E’ center [18], so active hydrogen released during UV irradiation, according to Equation (3), will be mostly consumed for reaction (4) rather than (5). Higher concentration of hydrogen in Material 6 helps to remove NBOHC completely from this material.
( ≡ Si – O *) + H → ( ≡ Si – OH) (4)
(≡ Si * ) + H → (≡ Si – H ) (5)
Fiber, based on low OH Material 4, dried in carbon monoxide atmosphere, shows comparable stability under UV irradiation with the best examples of high OH silicas. As a result, it could be a good alternative to high OH silicas for numerous applications requiring wavelength range beyond 700 nm. We can conclude that OH content in silica is not the main criterion that defines solarization stability. Much more important is the concentration of hydrogen inside silica of selected core material and the optical fiber manufacturing process, both factors influence the creation of precursors for defects. H2 excess in the core rod material facilitates growth of the precursor for E’ defect during preform manufacturing and fiber drawing (see equation 2); however, saturation of drawn fibers with hydrogen helps to minimize induced attenuation in the UV region by suppression of NBOHC and E’ centers according to reactions (4 and 5). Induced loss comparison between fibers not treated with H2 and fibers saturated to 5*1018 H2 molecules/cm3 shows that such concentration is sufficient, not just for elimination of NBOHC with fast reaction (4), but also to shift equilibrium between reactions (3) and (5), in favor to (5), and minimizes induced loss at 214 nm 5-10 times (See Figure 11).
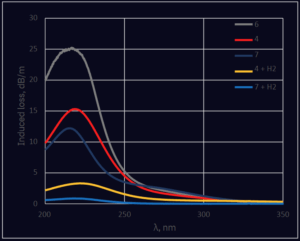
Figure 11. Spectra of Induced attenuation after ArF laser irradiation (dose 1000 J/cm2). Measurement done for 1 m fibers, 200/220/245P, or 200/220/245СP for saturated with H2 samples.

Figure 12. Kinetics of induced attenuation growth during irradiation with ArF laser (193 nm). 96 min irradiation is equal to dose 1000 J/cm2.
Observations of kinetics of induced loss at 214 nm show fast attenuation growth during the first minute of irradiation for fibers with no H2 treatment and H2 saturated fibers. While this is valid for the initial measurement, it might be much less than 1 minute. Later measurements show no changes or even negative growth of induced attenuation for H2 saturated fibers; however, fibers with no H2 treatment show graduate growth of induced loss values. We propose the following explanation for this phenomenon: in hydrogen-saturated fibers almost all hydrogen in the silica body stays in molecular form. Reaction between E’ centers and molecular hydrogen (6) is much slower than the process of E’ centers created under 193 nm ArF laser irradiation. However, atomic hydrogen, generated in (6) activates a faster reaction (5). Equilibrated E’ center concentration in a sample under irradiation is defined by equations (3, 5 and 6)
(≡ Si * ) + H2 → (≡ Si – H ) + H (6)
Fiber stability under gamma irradiation
Ceram Optec manufactured a number of test fibers for ITER project H alpha diagnostics [7, 19]. Studies of comparative behavior of H2 saturated and non-saturated fibers were conducted for wavelength range 400-700 nm with gamma irradiation dose 15 KGy. For fiber based on core Material 7, attenuation with peak at 630 nm was growing to values close to 1 dB/m during irradiation. Fiber based on core Material 7 and saturated with H2 showed loss fluctuations not exceeding 0.02 dB/m. This fiber was recommended for H alpha diagnostics in the ITER project [19].
CONCLUSIONS
Extensive search of silicas that could be used as a core material for all-silica fibers was performed. For use in the UV and UV-VIS (λ=200-700nm) wavelength region, fibers based on high OH silica Material 7 (see Table 1) were found to have good pristine attenuation in required wavelength region and lowest induced loss under UV irradiation. However, OH peaks at 730 nm, 950 nm, 1240 nm, and 1389 nm justified necessary search for low OH materials for longer wavelengths. Material 4 (Table 1), silica not containing any Cl and F with average OH concentration of 0.2 ppm, showed broadband pristine attenuation curve and moderate induced loss under UV.
The influence of POVD and PCVD preform deposition techniques on final fiber properties was also studied and provided findings showing that the lower temperature of the silica seed in the PCVD process allows one to slow down chemical reactions and diffusion processes in the silica substrate rod. Furthermore, silica with low concentration of OH groups led to reduction in losses at wavelengths of 266, 330 and 640 nm. Preforms with a UV silica core after PCVD were found to have higher solarization resistance.
The manufacturing method of hydrogen-saturated all-silica fibers was elaborated and presented. Hydrogen saturation capability and stability of hydrogen concentration during storing at room temperature is ensured by a combination of hermetic carbon and thermally stable polyimide coatings. H2 saturation significantly improves stability under gamma and UV radiation providing the possibility to manufacture fibers for λ= 200-900 nm.
Further development of radiation resistant fibers could be done in Ceram Optec SIA based on low OH, halide-free silica and possible replacement of H2 with D2.
REFERENCES
[1] Heraeus Conamic, Pure Silica Rods for Specialty Fiber Applications. https://www.heraeus.com/media/media/hca/doc_hca/products_and_solutions_8/optical_fiber/Pure_Silica_Rods_ EN.pdf
[2] OHARA QUARTZ CO., LTD., Synthetic Quartz, https://www.ohara-quartz.co.jp/English/products.html
[3] Corning LTD., Optical Materials Product Information, https://www.corning.com/media/worldwide/csm/documents/HPFS_Product_Brochure_All_Grades_2015_07_21
[4] Bachman P., “Review of plasma deposition applications: preparation of optical waveguides”, Pure & Appl. Chem., 57, 1299-1310 (1985).
[5] Gouskov M., Danilov E., Aslami M., Wu D., “Method of making a tubular member for optical fiber production using plasma outside vapor deposition”, US Patent 6253580 (2001).
[6] Neuberger W., Volodjko V., Blinov L., “Method of forming an optical fiber preform using an E020 plasma field configuration”, US Patent 6138478 (2000).
[7] Gusarov A., Vukolov K.Y., Orlovskiy I.I., Andreenko E.N., “Radiation induced absorption of hydrogen-loaded pure silica optical fibers with carbon coating for ITER diagnostics”, Fusion Engineering and Design, 151, 111356, 1-8 (2020).
[8] Heraeus Conamic, Specialty fiber preforms for the most demanding applications, https://www.heraeus.com/media/media/hca/doc_hca/products_and_solutions_8/optical_fiber/Specialty_Fiber_Pr eforms_EN.pdf .
[9] Grishchenko A., “Effect of the preform fabrication process on the properties of all-silica fibres”, Quantum Electronics, 47,1115-1119 (2017).
[10]Noguchi K., Shibata N., Uesugi N., Negishi Y., “Loss increase for optical fibers exposed to hydrogen atmosphere”, Journal of Lightwave Technology, LT-3, 2, 236-243 (1985).
[11]Shelby J.E., “Protonic species in vitreous silica”, Journal of Non-Crystalline Solids, 179, 138-147 (1994).
[12]Schmidt B., Holtz F., Beny J., “Incorporation of H2 in vitreous silica, qualitative and quantitative determination from Raman and infrared Spectroscopy”, Journal of Non-Crystalline Solids, 240, 91-103 (1998).
[13]Davis K.M., Agarwal A., Tomozawa M., Hirao K., “Quantitative infrared spectroscopic measurement of hydroxyl concentration in silica glass,” Journal of Non-Crystalline Solids, 203, 27-36 (1996).
[14]Friebele E, Sigel G., Griscom D.,“Drawinginduced defect centers in a fused silica core fiber”, Applied Physics Letters, 28, 516 (1976).
[15] Kajihara K., Hirano M., Skuja L, Hosono H, “Reactions of SiCl groups in amorphous SiO2 with mobile interstitial chemical species: Formation of interstitial Cl2 and HCl molecules, and role of interstitial H2O molecules”, Journal of Applied Physics, 98, 043515, 1-9 (2005).
[16]Semenov S.L., Bogatyrev V.A.,Malinin A.A., “Hermetically coated specialty optical fibers” Proc. of SPIE Vol. 7839, 1-4 (2010)
[17]Tomashuk A. and Zabezhailov M.,” Formation mechanisms of precursors of radiation-induced color centers during fabrication of silica optical fiber preform”, Journal of Applied Physics, 109, 083103, 1-11 (2011).
[18]Skuja L., Kajihara K., Hirano M., Hosono H. “Fluorine laser-induced silicon hydride Si–H groups in silica”, Journal of Non-Crystalline Solids, 353, 526–529, (2007).
[19]Vukolov K.Y., Andreenko E.N., Orlovskiy I.I., Shikalov V.F., “Irradiation test of fiber optics for H-alpha diagnostics in ITER” Fusion Engineering and Design, 146,796-799 (2019).